Generate cloud applications without any single line of code
Define data sources and transforms
1 - Define data sources
2 - Define transformations including cross tabs
3 - Define navigations
Visualizations
1 - Choose from variety of visualizations
2 - Configure each visualization for desired output
3 - Create dashboards as collection of visualizations
4 - Complete control on placement of dashlets in a dashboard
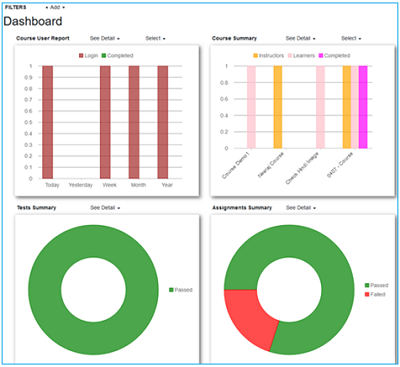
Advanced Dashboards
Create advanced dashboards to get complete management overview Advanced Dashboards
Choose from a variety of chart visualizations, like given below:
1 - Column charts show vertical bars and allow you to compare values of items across categories.
2 - Bar charts show horizontal bars.
3 - Scatter charts use X and Y coordinates to show patterns within the data.
4 - Line charts show trends over a period of time or across categories.
5 - Area charts are line charts with the area below the line filled with color.
6 - Bubble charts are Scatter charts with a third data value that determines the size of the symbol.
7 - Candlestick charts present items with high, low, open, and close values.
8 - Spline charts are line charts that plot curves rather than angled lines through the data points.
9 - Funnel chart.
10 - Step chart.
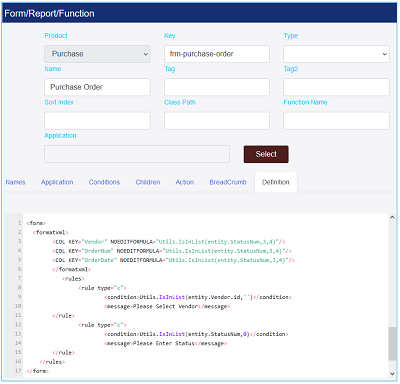
Forms
1 - Define SQL for data sources including child tables
2 - Define formatting and lookups
3 - Form is rendered automatically with add/edit and save feature
4 - Json Schema or Typed Class based auto form generation